The tape diagram is a sweet way to show ratio relationships. Students often have difficulty seeing how ratios can result in larger or smaller numbers. The image below explains one simple way of using it.
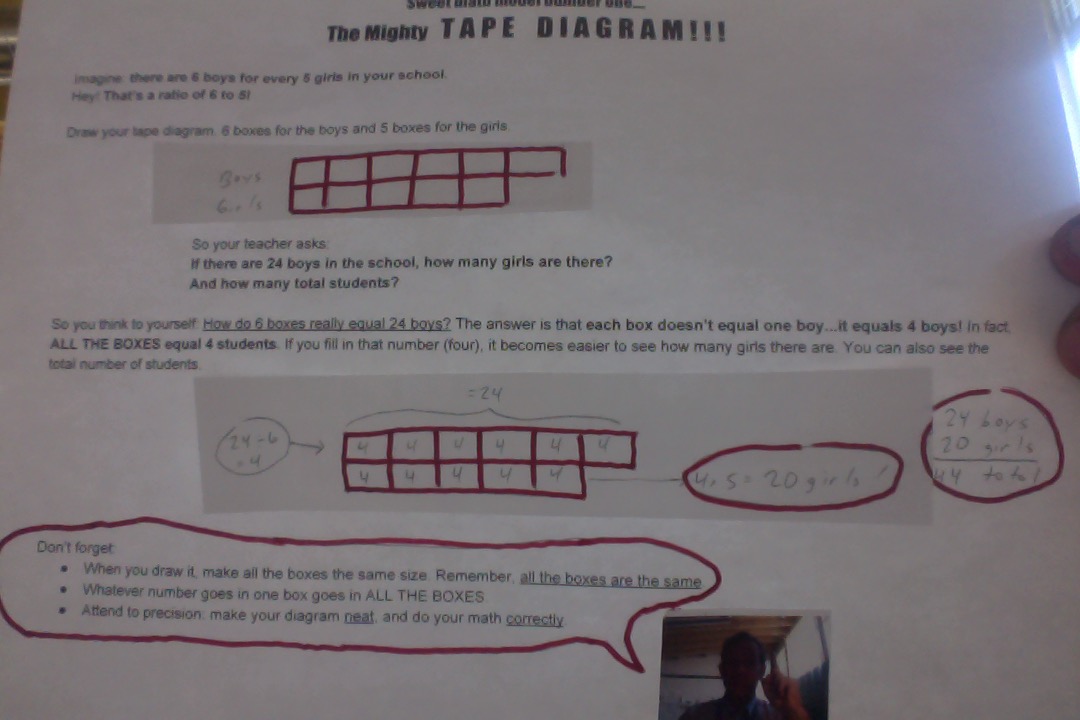
This is pretty basic, but notice also that we can measure the DIFFERENCE between boys and girls. Notice that the difference is one segment of the diagram, which would also be four students. This can be very handy in questions like "there are 4 more boys than girls, so how many boys/girls are there?"
The tape diagram is a great tool for understanding ratio work!
In coming posts, we'll look at other tools like the ratio table, the double number line, and the bar model. They are all great for work like this! Let me know if you have questions or comments!
The tape diagram is a great tool for understanding ratio work!
In coming posts, we'll look at other tools like the ratio table, the double number line, and the bar model. They are all great for work like this! Let me know if you have questions or comments!
